
Investing · 8 min read
Compound interest is the only concept in personal finance that explains both how wealth is built and how debt destroys people. It is the same mechanism pointed in opposite directions. Understand it properly once and a dozen other decisions — which debt to pay first, whether to start investing now or later, why a 1% fee matters — stop requiring separate explanations.
Simple Versus Compound
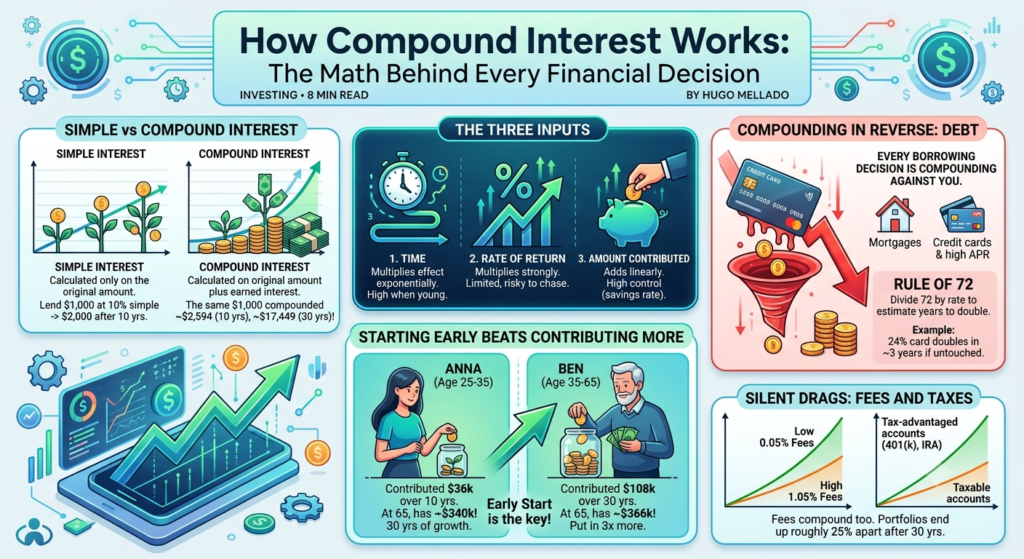
Simple interest is calculated only on the original amount. Lend $1,000 at 10% simple interest and you earn $100 every year, forever, because the base never changes. After ten years you have $2,000.
Compound interest is calculated on the original amount plus all the interest already earned. The same $1,000 at 10% compounded annually earns $100 in year one, then $110 in year two because the base is now $1,100, then $121, and so on. After ten years you have about $2,594. After thirty years, simple interest gives you $4,000 and compounding gives you roughly $17,449.
That gap is not a rounding difference. It is the entire point, and it comes from doing nothing except leaving the interest where it was.
The Three Inputs
Every compounding calculation depends on exactly three things, and they are not equally powerful.
| Input | What it does | How much control you have |
|---|---|---|
| Time | Multiplies the effect exponentially | High when young, none retroactively |
| Rate of return | Multiplies the effect strongly | Limited and risky to chase |
| Amount contributed | Adds linearly | High, through savings rate |
Time is the input people underuse and the one they cannot buy back. Rate is the one they obsess over, usually by taking more risk than they should. Contributions are the one they actually control day to day.
Why Starting Early Beats Contributing More
Consider two savers, both earning 7% annually. Anna invests $300 a month from age 25 to 35, then stops completely and never adds another dollar. Ben invests nothing until 35, then invests $300 a month until he turns 65.
Anna contributed $36,000 over ten years. Ben contributed $108,000 over thirty. At 65, Anna has roughly $340,000 and Ben has roughly $366,000. Ben put in three times as much money to end up in approximately the same place. Anna’s advantage was thirty years of untouched growth on a small base.
The lesson is not that Ben wasted his time — he built real wealth. It is that the first dollars invested are worth far more than the last ones, and no amount of later diligence fully replaces early time in the market.
Compounding Frequency
“Compounded annually,” “monthly,” and “daily” are not marketing language. The more often interest is added to the base, the faster the base grows. At 12% on $10,000, annual compounding yields $1,200 in the first year. Monthly compounding yields about $1,268. Daily compounding yields about $1,275.
The differences look modest over one year and matter enormously over decades — and they matter most on the debt side, where credit cards typically compound daily. This is why a credit card balance grows faster than the quoted annual rate suggests.
The Rule of 72
A shortcut worth memorising: divide 72 by the annual rate to estimate how many years it takes for money to double. At 6%, roughly twelve years. At 9%, about eight. At 2%, thirty-six years.
Run the same rule on your debt. A 24% credit card balance doubles in about three years if left untouched. That single calculation has convinced more people to attack their balances than any lecture about discipline.
The Same Force Working Against You
Every borrowing decision is compounding in reverse, with you on the paying side. On a mortgage, most of your early payments go to interest rather than principal. On a credit card, minimum payments are calibrated so that compounding keeps the balance alive for years. On a car loan, you compound interest on an asset that is losing value at the same time.
This is why paying off a balance charging 22% is such a powerful move. A guaranteed 22% return, with no market risk and no tax on the gain, does not exist anywhere else in finance. When someone asks whether to invest or pay down high-interest debt, compounding gives the answer before any market forecast is needed.
The Silent Drag: Fees and Taxes
Fees compound too. Two identical portfolios growing at 7% for thirty years, one paying 0.05% in fund fees and the other paying 1.05%, end up roughly 25% apart in final value. Nothing about the second portfolio was worse except the annual deduction — and it never showed up as a bill you noticed.
Taxes work similarly. Gains that stay invested compound on the full amount, while gains realised and taxed each year compound on what remains. This is the structural reason tax-advantaged accounts such as 401(k)s and IRAs outperform taxable accounts holding identical investments.
What Compounding Requires From You
- Time in the market rather than perfect timing of it
- Reinvested dividends and interest instead of withdrawn income
- Low, transparent costs, because they compound against you
- Not interrupting the process — selling in a downturn resets the base you spent years building
- Consistency in contributions, which matters more than their size
The Honest Caveats
Real markets do not deliver a smooth 7% every year. They deliver a scattered sequence of gains and losses that averages out over long periods, which means the elegant curve in every compounding chart is a summary, not a forecast. Sequence matters, especially near retirement, when a large loss early in withdrawals does lasting damage.
Compounding is also relentlessly ordinary. It rewards decades of unremarkable behaviour and offers nothing exciting along the way. That is precisely why it works for the people patient enough to leave it alone, and why it is the closest thing to a free lunch that finance actually offers.
Illustrative figures assume constant returns for clarity. Real markets fluctuate and past performance does not predict future results.
Sources and further reading
The explanations above are checked against official regulators, statistical agencies, standards bodies and non-profit financial education organisations. Use these primary sources to verify figures and rules before you act on them.
- OpenStax — “Principles of Economics” (open-access university textbook)
- Federal Reserve Board — “The Fed Explained: What the Central Bank Does” (PDF)
- Federal Reserve — H.15 Selected Interest Rates
- U.S. SEC — Ten things to consider before you make investing decisions
- Federal Reserve Bank of St. Louis — Economic education resources
Related reading
- How to Save Money in the United States: A System That Actually Works
- The Emergency Fund: How Much You Really Need and Where to Keep It
- High-Yield Savings vs. CDs vs. Money Market Funds: Where Should Your Cash Live?
This content is for informational and educational purposes only and does not constitute financial, investment or tax advice. Always do your own research, and consider speaking with a licensed professional about your specific situation.