
Trading · 6 min read
Technical analysis is the study of price and volume history in the hope of anticipating what comes next. Academics argue about whether it predicts anything, and that argument misses why it matters in practice: when millions of traders watch the same levels on the same charts, their collective reaction gives those levels real force. A resistance line matters partly because so many sell orders are sitting on it.
What follows is the vocabulary — the concepts you need before any specific strategy makes sense.
Reading a Candlestick
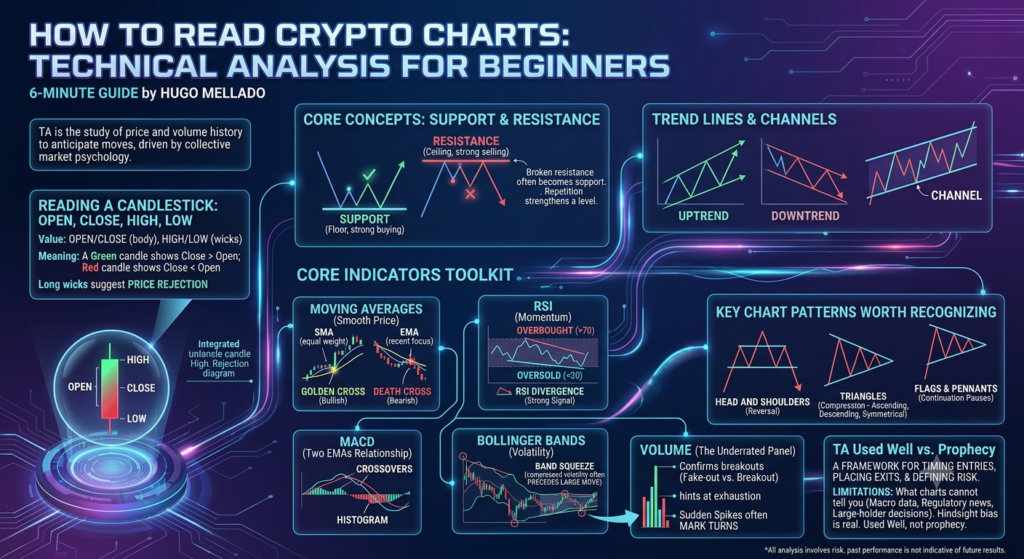
Nearly every crypto chart displays candlesticks. Each candle covers one time period — a minute, an hour, a day — and packs four numbers into a single shape.
| Value | Meaning | Where you see it |
|---|---|---|
| Open | Price when the period began | One end of the candle body |
| Close | Price when the period ended | The other end of the body |
| High | Highest price reached | Tip of the upper wick |
| Low | Lowest price reached | Tip of the lower wick |
A close above the open usually renders green, a close below it red. Long wicks are informative in their own right: they show where price went and was rejected, which is often more revealing than where it settled.
Support and Resistance
Support is a level where buying has historically been strong enough to halt a decline — a floor. Resistance is where selling has been strong enough to stop an advance — a ceiling. Both are identified by looking for prices at which the market has turned repeatedly.
Two conventions do most of the work here. Once broken, roles tend to flip: former resistance often becomes support, and broken support often becomes resistance. And repetition strengthens a level — one that has held four times carries more weight than one that has held twice, because more participants are watching it.
Trend Lines and Channels
A trend line connects a sequence of higher lows in an uptrend, or lower highs in a downtrend, turning direction into something you can see and trade against. When two roughly parallel lines bracket price above and below, the result is a channel: some traders work the edges, buying near the lower boundary and selling near the upper, while others wait for a break out of the channel as evidence the trend is accelerating.
The Core Indicators
Moving Averages
A moving average smooths noise into a single line. The simple moving average weights every period equally, with the 50-day and 200-day being the two most watched in crypto. The exponential moving average weights recent prices more heavily and therefore reacts faster; the 12- and 26-day EMAs are standard.
The crossovers have names because so many people trade them. A golden cross — the 50-day rising above the 200-day — is read as bullish, and a death cross as the reverse. Their reliability is debatable, but the volume response around them is not.
RSI
The relative strength index measures momentum on a 0-100 scale. Above 70 is traditionally called overbought, below 30 oversold — with the important caveat that in a strong trend, RSI can sit at an extreme for weeks while price keeps going. Divergence tends to be the more useful signal: price making a new high while RSI makes a lower high suggests momentum is draining out of the move.
MACD
MACD tracks the relationship between two EMAs, usually the 12- and 26-day. The MACD line crossing above its signal line reads bullish and below it bearish, while the histogram shows how wide the gap is. As with RSI, divergence from price is generally treated as more meaningful than the crossovers alone.
Bollinger Bands
A moving average flanked by two standard-deviation bands. Touching the upper band suggests price has stretched; touching the lower suggests the opposite. The more interesting configuration is the squeeze, when the bands narrow sharply — a sign of compressed volatility that often precedes a large move, though it says nothing about direction.
Volume
The most underrated panel on the chart. Volume is what separates a breakout from a fake-out: heavy participation confirms a move, thinning participation during an established trend hints at exhaustion, and sudden spikes frequently mark the turns.
Patterns Worth Recognizing
Head and Shoulders
Three peaks — a shoulder, a higher head, then a shoulder roughly level with the first. The neckline drawn through the troughs is the level that matters, and a decisive break below it is read as a reversal, with a conventional target equal to the head’s height projected down from the neckline.
Triangles
Compression patterns where the range narrows toward a point. Symmetrical triangles can resolve either way; ascending triangles with a flat top and rising lows are usually read as bullish; descending triangles with a flat bottom and falling highs as bearish.
Flags and Pennants
Brief pauses after a sharp move — the flagpole. Flags consolidate in a rectangle, pennants in a small symmetrical triangle, and both are treated as continuation patterns that tend to resolve in the direction of the move that preceded them.
What Charts Cannot Tell You
The limitations are real and worth stating plainly. Regulatory announcements, exchange failures, macroeconomic data, and large-holder decisions move markets and appear nowhere on the chart until after the fact. Patterns are far easier to identify in hindsight than in real time, and the same chart routinely supports several defensible readings.
Used well, technical analysis is a framework for timing entries, placing exits, and defining risk before a trade rather than during it. Treated as prophecy, it becomes an elaborate way to justify a decision you had already made.
This content is for informational and educational purposes only and does not constitute financial or investment advice. Trading involves substantial risk of loss.
Sources and further reading
The explanations above are checked against official regulators, statistical agencies, standards bodies and non-profit financial education organisations. Use these primary sources to verify figures and rules before you act on them.
- FINRA — For Investors: education and tools
- U.S. Commodity Futures Trading Commission — Digital assets
- National Bureau of Economic Research — Business cycle dating
- U.S. SEC — Ten things to consider before you make investing decisions
Related reading
- Crypto Trading Strategies for Beginners: A Practical Guide to Getting Started
- Understanding Crypto Market Cycles: Bull Markets, Bear Markets, and Everything Between
- How to Build a Diversified Crypto Portfolio: Strategy, Allocation, and Risk Management
This content is for informational purposes only and does not constitute financial advice. Cryptocurrency investments carry high risk — always do your own research.